
Human Settlement and Natural Hazards in Canada
The National Human Settlement Layer (NHSL) is a collection of thematic datasets that describe the physical, social and economic characteristics of urban centres and rural/remote communities across Canada. Detailed information on land use, buildings, people and capital assets are provided at the Census Dissemination Area administrative level for more than 454,000 settled areas across Canada.
The Physical Exposure Layer includes a delineation of human settlement areas and related functional land use classes across Canada, and provides detailed information on construction type, occupancy and design level of more than 9.1 million buildings; population dynamics at different times of day for 35.1 million people, and; capital asset valuation of buildings and contents totaling more than 8.3 trillion CAD$.
The Social Fabric Layer utilizes Census demographic data to evaluate broad spatial patterns of vulnerability, and neighbourhood-level capacities to withstand and recover from disaster events based on intrinsic characteristics of housing, family structure, individual autonomy and financial agency.
Although developed to support quantitative risk assessments and implementation of the Sendai Framework for Disaster Risk Reduction at local and regional scales in Canada, the NHSL is also suitable for use in other integrated landscape modeling applications, including climate change adaptation and sustainable land use planning.
All products are released under the Open Government Licence - Canada.
-
Organization name:
Government of Canada;Natural Resources Canada;Lands and Minerals Sector, Geological Survey of Canada -
Email:
GSC.info.CGC@NRCan.gc.ca
Physical Exposure
The Physical Exposure component of the National Human Settlement Layer (NHSL) includes a delineation of built-up areas and related functional land use classes for Census Dissemination Areas in urban centres and rural/remote communities across Canada.
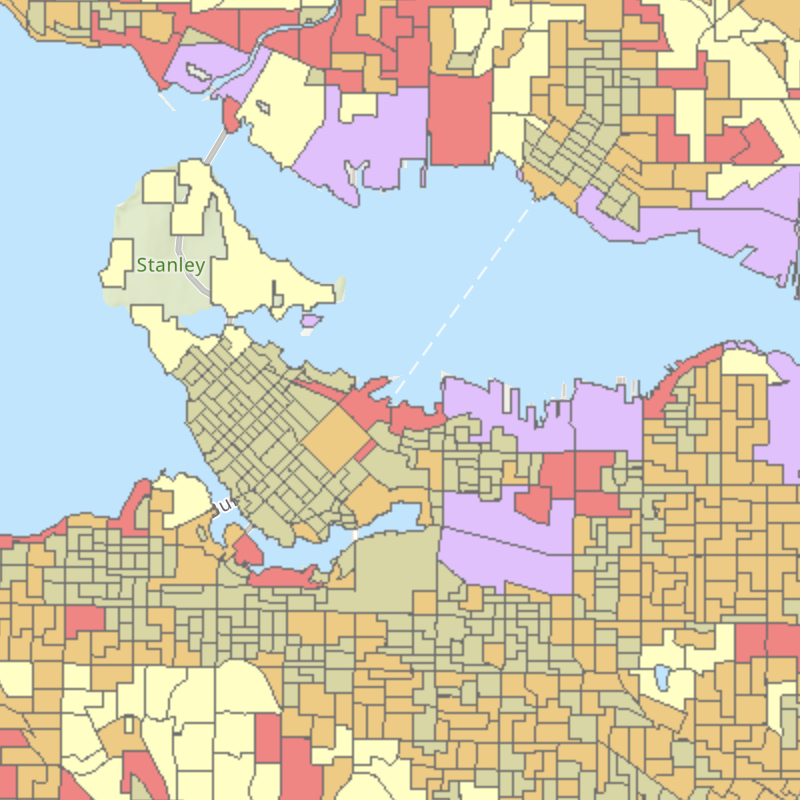
It provides detailed information on construction type, occupancy and design level for more than 9.1 million buildings; population dynamics at different times of day for 35.1 million people, and; capital asset valuation of buildings and contents totalling more than 8.3 trillion CAD$.
The building portfolio is classified using a combination of 36 construction taxonomies that include different types of wood, concrete, masonry, steel and prefabricated structures; and 33 occupancy classes that include a mix of residential, civic, commercial and industrial functional uses. Context-specific mapping schemes for each combination of land use, construction type and occupancy class are used to allocate a distribution of building classes that reflect the overall structural form and function of a given neighbourhood.
Building populations at different times of day are estimated for standard workday hours when people are in offices, schools or other group facilities (9am-5pm); for morning and evening commute hours when people are in transit (7am-9am; 5pm-7pm), and; for evening hours when the majority of people are at home (7pm-7am).
Capital asset valuation is based on industry replacement costs of building archetypes for representative regions across Canada.
The building inventory is aligned with international standards for multi-hazard risk assessment and is suitable for use in other land use assessment applications that may require specific information on the form and/or function of the built environment.
Data Resources
National Scale
| Resource Name | Format | Links | |
|---|---|---|---|
| Physical Exposure polygon geometry (Canada) | Web Service | ESRI REST | Access |
| Physical Exposure polygon geometry (Canada) | Dataset | GPKG | Access |
| Physical Exposure point geometry (Canada) | Dataset | GPKG | Access |
| Data dictionary | Document | EXCEL | Access |
Regional Scale
| Resource Name | Format | Links | |
|---|---|---|---|
| Physical Exposure polygon geometry (AB) | Dataset | GPKG | Access |
| Physical Exposure point geometry (AB) | Dataset | GPKG | Access |
| Physical Exposure polygon geometry (BC) | Dataset | GPKG | Access |
| Physical Exposure point geometry (BC) | Dataset | GPKG | Access |
| Physical Exposure polygon geometry (MB) | Dataset | GPKG | Access |
| Physical Exposure point geometry (MB) | Dataset | GPKG | Access |
| Physical Exposure polygon geometry (NB) | Dataset | GPKG | Access |
| Physical Exposure point geometry (NB) | Dataset | GPKG | Access |
| Physical Exposure polygon geometry (NL) | Dataset | GPKG | Access |
| Physical Exposure point geometry (NL) | Dataset | GPKG | Access |
| Physical Exposure polygon geometry (NS) | Dataset | GPKG | Access |
| Physical Exposure point geometry (NS) | Dataset | GPKG | Access |
| Physical Exposure polygon geometry (NT) | Dataset | GPKG | Access |
| Physical Exposure point geometry (NT) | Dataset | GPKG | Access |
| Physical Exposure polygon geometry (NU) | Dataset | GPKG | Access |
| Physical Exposure point geometry (NU) | Dataset | GPKG | Access |
| Physical Exposure polygon geometry (ON) | Dataset | GPKG | Access |
| Physical Exposure point geometry (ON) | Dataset | GPKG | Access |
| Physical Exposure polygon geometry (PE) | Dataset | GPKG | Access |
| Physical Exposure point geometry (PE) | Dataset | GPKG | Access |
| Physical Exposure polygon geometry (QC) | Dataset | GPKG | Access |
| Physical Exposure point geometry (QC) | Dataset | GPKG | Access |
| Physical Exposure polygon geometry (SK) | Dataset | GPKG | Access |
| Physical Exposure point geometry (SK) | Dataset | GPKG | Access |
| Physical Exposure polygon geometry (YT) | Dataset | GPKG | Access |
| Physical Exposure point geometry (YT) | Dataset | GPKG | Access |
Social Fabric and Capacity Thresholds
The Social Fabric component of the National Human Settlement Layer (NHSL) utilizes available Census demographic data to evaluate broad spatial patterns of vulnerability, and neighbourhood-level capacities to withstand and recover from disaster events based on characteristics of housing, family structure, individual autonomy and financial agency.
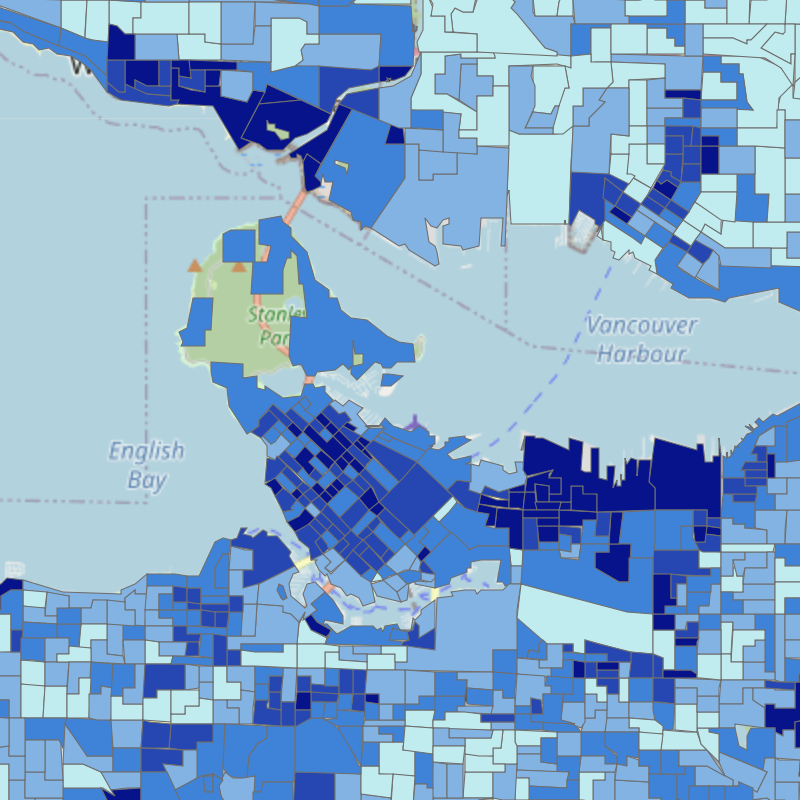
Vulnerability and capacity threshold indicators help to identify underlying patterns of social inequity that may exist within a given community or region, and to address the question of who is likely to bear the greatest burden of risk following a disaster event. Levels of vulnerability for each component of the social vulnerability index are assessed using analytic methods adapted from the Cutter 'Hazards of Place Model' to screen and rank demographic variables based on their capacity to explain spatial patterns across a broad range of community archetypes including dense urban centres, surrounding suburban/exurban regions, and more distant rural and remote settlements.
Composite indicators describing characteristics of housing conditions, family structure, individual autonomy and financial agency provide a means of comparing relative levels of vulnerability from one region to another across Canada and help identify specific neighbourhoods within which capacities to withstand and recover from disaster events may be strained. Indicators are reported at the Census Dissemination Area level and can be used in conjunction with information on specific hazard threats to identify both potential hotspots of concern within a community or region, and areas in which proactive investments in planning and capacity development may be effective in building disaster resilience and longer-term sustainability.
Data Resources
Report a problem on this page
- Date modified: